
Measuring blog engagement starts with tracking the right metrics. While pageviews and follower counts might seem important, they often fail to provide actionable insights. Instead, focus on KPIs that reveal true audience behavior, like conversion rates, click-through rates (CTR), and average time on page. These metrics help you understand how readers interact with your content and whether your efforts are driving meaningful results.
Here’s a quick breakdown of the key engagement KPIs every blogger should monitor:
- Pageviews: Total page loads, including repeat visits. Useful for gauging traffic trends.
- Unique Visitors: The actual number of individuals visiting your blog, showing audience size.
- Average Time on Page: Indicates how long readers stay engaged with your content.
- Scroll Depth: Measures how far down a page users scroll, highlighting engagement levels.
- Bounce Rate: Tracks the percentage of visitors who leave after viewing a single page.
- Click-Through Rate (CTR): Reflects how effectively your CTAs or links drive action.
- Pages per Session: Shows how many pages a visitor explores in one visit.
Using tools like Google Analytics and Microsoft Clarity, you can track these KPIs, identify patterns, and optimize your content strategy. For example, if your scroll depth drops at 25%, it might signal that your introduction needs improvement. Similarly, a high bounce rate could mean your content isn’t aligned with search intent.
Key takeaway: Don’t track every metric. Focus on 5–7 KPIs that align with your blog’s goals – whether it’s growing an email list, increasing ad revenue, or boosting affiliate sales. Regularly review your data, compare it to industry benchmarks, and refine your strategy based on what works.
How to Measure the Success of a Blog Post (The P-E-G Metrics)
sbb-itb-112c64b
Awareness KPIs
Awareness KPIs focus on the top of your funnel, showing how many people are discovering and viewing your blog content. Without understanding your reach, it’s impossible to tell if your content is connecting with the right audience.
"Having great content that no one sees is like having a beautiful Porsche that never leaves the garage." – Jodie Booras, PACIFIC Digital Group
These metrics are the starting point for all other performance analysis. Let’s break down the key ones, starting with pageviews.
Pageviews
Pageviews represent the total number of times your blog pages are loaded or refreshed. For example, a single person visiting a page, clicking a link, and refreshing counts as three pageviews. This metric captures every page load, including repeat visits from the same individual.
An increase in pageviews suggests growing popularity. On average, B2B websites see around 7,650 pageviews per month, while B2C companies average 20,940 monthly pageviews. However, keep in mind that repeat refreshes can inflate these numbers.
"Pageviews can tell you where traffic is landing, but it can also be somewhat shallow… a single user reopening or refreshing a page over and over can inflate your pageview metrics." – Michael O’Neill, Content Manager, Brafton
To track pageviews, use Google Analytics under Behavior > Site Content > All Pages. This will help you identify your most-viewed posts and understand which topics resonate best with your audience.
Unique Visitors
Unique visitors (also called "Users" in analytics tools) measure the number of individual people visiting your blog within a specific timeframe, typically a month. Each person is counted only once, no matter how many times they visit or how many pages they view.
This metric shows your true audience size and the reach of your brand. A good starting point for a business blog is 5,000 unique visitors per month, while top-performing blogs often exceed 50,000 unique visitors monthly. On average, B2B websites see about 3,960 sessions per month, whereas B2C sites average 9,400 sessions.
"Unique visitors show your blog’s overall reach and brand awareness – how large is the top of your funnel?" – Charles Scott, Founder, ExpertBeacon
Analytics tools assign a unique ID to each visitor using cookies. However, if someone clears their cookies or uses a different device, they might be counted as a new visitor. While not 100% precise, this metric is accurate enough for practical analysis.
Impressions
Impressions go beyond direct visits, measuring how often your blog posts appear in search results or social media feeds. This metric gives you an idea of your potential reach – how many people might see your content.
If you notice high impressions but low clicks, it’s a sign of a visibility problem. Your content is showing up, but your titles or meta descriptions aren’t enticing enough to earn clicks. Use Google Search Console to spot these issues – look for pages with lots of impressions but low click-through rates. Then, tweak your headlines and descriptions to turn visibility into traffic.
For instance, if a blog post appears in search results 10,000 times but gets only 200 clicks, your click-through rate (CTR) is 2%. Improving the title alone could double or triple those clicks without changing the content itself. Similarly, on social media, the more often your posts appear in feeds, the better your chances of attracting new readers.
With 68% of blog traffic now coming from smartphones and tablets, ensuring your content looks great on mobile devices is crucial for converting impressions into visits.
Measuring awareness through these metrics lays the groundwork for diving deeper into engagement and behavior analysis.
Engagement Depth KPIs
Awareness metrics might tell you how many people see your content, but engagement depth KPIs reveal whether those visitors are actually connecting with it. These metrics dig into how readers interact with your content and whether it holds their attention. Let’s break down some key engagement depth KPIs to better understand reader behavior.
Average Time on Page offers a quick snapshot of how long visitors stay. For context, B2B blogs average 1 minute and 35 seconds per page, while B2C sites hover around 1 minute and 25 seconds. If your numbers fall below these benchmarks, it could mean your content isn’t holding attention. Even with high pageviews, a low average time on page often points to unmet reader expectations and a lack of genuine engagement.
Scroll Depth measures how far readers scroll before leaving the page, using checkpoints like 25%, 50%, 75%, and 100%. Since 79% of web users scan instead of reading word-for-word, a high drop-off rate at the 25% mark could signal that your introduction isn’t compelling enough. Pairing scroll depth with time on page helps you differentiate between readers actively engaging with your content and those who simply landed on the page without diving in.
Pages per Session reflects how well your content encourages readers to explore more. On average, websites see about 7 page views per visit. Strong internal links that guide readers to related content can significantly boost this metric.
Social shares and comments also offer valuable clues about engagement. Mehdi Hussen from SalesHandy highlights the importance of tracking social activity:
"Social sharing is the key. I check how many times the blog is shared on social media and track its performance across all platforms".
Comments go even further, showing that readers are not only consuming your content but also taking the time to share their thoughts publicly. These interactions not only deepen engagement but also signal value to search engines, extending your content’s reach.
Engagement Rate by Reach
Having a large follower count might look impressive, but it doesn’t necessarily reflect how engaged your audience is. That’s where Engagement Rate by Reach (ERR) comes in – it measures how well your content connects with the people who actually see it.
Here’s the formula for ERR:
((Likes + Comments + Shares + Saves) / Reach) × 100.
In this equation, reach refers to the number of unique accounts that saw your post, not your total follower count. This distinction matters because social media algorithms often limit how many followers actually see your content.
As Christina Newberry from Hootsuite explains:
"Reach can be a more accurate measurement than follower count now that social media is officially in its algorithm era. Not all your followers will see all your content."
Each element in the formula reveals something unique about your audience’s interaction with your content. For example:
- Likes show basic approval.
- Comments reflect deeper interest.
- Shares help spread your content to a broader audience.
- Saves indicate that your content is valuable enough to revisit.
Interestingly, as of 2026, platforms are giving more weight to saves and shares compared to simple likes. This shift highlights the importance of understanding how different interactions contribute to your overall engagement.
Engagement Rates Across Platforms
Engagement rates can vary widely depending on the platform. Here’s a snapshot of average rates:
- TikTok: 2.5%
- Instagram: 0.45% (a noticeable decline)
- Facebook and X (formerly Twitter): Around 0.15%
- LinkedIn: A standout for B2B content with 5.00%.
These differences emphasize why focusing on quality engagement is far more impactful than chasing large follower numbers.
InfluenceFlow provides an insightful comparison:
"A creator with 50,000 followers but 200 likes per post has a very different story than a creator with 5,000 followers and 800 likes per post. One has reach. The other has influence."
Average Time on Page
Average Time on Page, referred to as "Average Engagement Time" in Google Analytics 4, is a key metric that reveals how long visitors interact with your content. It’s a vital indicator of engagement depth, offering insights into how well your blog or website content resonates with readers.
On average, visitors across industries spend about 54 seconds on a page. For blog posts and educational articles, 2–3 minutes of engagement is considered strong. Specific benchmarks show that B2B websites typically see a median time of 1 minute and 35 seconds, while B2C sites average around 1 minute and 25 seconds. These numbers provide a helpful reference for evaluating your site’s performance.
Longer engagement times suggest that your content is high-quality and audience-focused. This not only signals search engines to rank your pages higher but also builds trust with your readers. Trust leads to meaningful actions like newsletter sign-ups or purchases – key outcomes for many websites.
Lora Raykova, a User Experience Content Strategist at NitroPack, highlights the importance of this metric:
"If a blog post averages two minutes, it’s likely engaging and grabs your audience’s attention. However, if it’s only 10 seconds, it means the content is probably not as relevant."
To improve engagement, start by comparing your average time on page to the estimated reading time of your content. For instance, if a 10-minute article only holds readers for 2 minutes, it might be time to adjust your approach. Break up dense text with subheadings, bullet points, and visuals to make it easier to digest. Also, ensure your content aligns with the search intent – readers should find exactly what they’re looking for. And don’t forget about page speed: 53% of mobile users leave pages that take more than 3 seconds to load, so a fast-loading site is crucial for even starting engagement.
Understanding how much time visitors spend on your pages can guide strategies to turn engagement into conversions.
Bounce Rate
Bounce rate represents the percentage of visitors who leave your blog after viewing just one page. It’s a simple yet powerful way to understand visitor behavior. In Google Analytics 4, bounce rate is calculated as the opposite of Engagement Rate. A session is considered "engaged" if it lasts more than 10 seconds, triggers a conversion event, or includes at least two pageviews.
On average, the bounce rate across all industries hovers around 45%. For B2B sites, it tends to be higher at 63.54%, while B2C sites average 57.29%. A bounce rate below 50% usually indicates that your content is doing its job – keeping visitors interested and encouraging them to explore further.
A lower bounce rate is a strong sign of engagement, showing that readers find your content valuable enough to stick around and check out more. On the flip side, a high bounce rate (above 70%) can highlight issues like slow loading times, poor alignment with search intent, or weak internal linking. However, context matters. For example, if a visitor quickly finds a recipe ingredient they were searching for and leaves, that’s still a success.
To reduce your bounce rate, start by improving internal linking. Add relevant links in prominent areas like above the fold, and suggest related posts at the end of your articles. Speed also matters – a page that loads in under 3 seconds is critical, as 53% of mobile users will leave if it takes longer. Aligning your content with search intent is another key step. Make sure your title, H1, and meta description accurately represent what’s on the page. Finally, create introductions of 100–150 words that immediately address the reader’s problem and set clear expectations for what they’ll find.
These strategies not only help lower bounce rates but also boost overall engagement, setting the stage for stronger blog performance and deeper audience connections.
Conversion KPIs
After looking at awareness and engagement, conversion KPIs help you understand whether your blog is driving readers to take action. These metrics go beyond just tracking visitors – they show how actively people interact with your content. While awareness tells you who’s arriving, conversion KPIs reveal who’s engaging and taking meaningful steps.
Click-Through Rate (CTR)
Click-Through Rate (CTR) measures the percentage of people who click on a specific link or call-to-action (CTA) after seeing it. The formula is straightforward: (clicks ÷ impressions) × 100. For example, if 1,000 people see your newsletter signup button and 50 click it, your CTR is 5%.
CTR provides insight into how well your content motivates passive viewers to take action. A high CTR indicates that your headlines, visuals, and CTAs resonate with readers and give them a reason to engage. Ideally, internal link CTRs should exceed 25%. If they’re below 10%, it’s a sign you need to tweak your approach.
"Focusing on click-through rate helps to define readers’ preferences, allowing your team to make the most engaging content." – Luke Wester, Miva
To improve CTR, consider repositioning your CTAs – place them higher on the page or use summary buttons to grab attention quickly. Experiment with different button designs, colors, and messaging through A/B testing to find what works best. Since about 45% of readers leave within the first 15 seconds, your CTAs need to stand out immediately.
Next, let’s examine how visitors interact with multiple pages on your site.
Pages per Session
Pages per Session measures the number of pages a visitor views in a single visit before leaving. A healthy benchmark is 2-3 pages per session, which indicates that users are exploring your site and finding it easy to navigate.
This metric reflects the success of your internal linking strategy. High numbers suggest visitors are smoothly moving through related content via well-placed links. However, if the number is unusually high, it could signal navigation issues or confusion.
To improve this metric, add relevant internal links to high-traffic posts to guide readers to related content. You can also structure your articles as a series, such as "Weekly Proven Strategies", to encourage readers to explore more. The aim isn’t just to increase clicks but to create a meaningful journey that adds value at every step.
Beyond page views, scroll behavior offers deeper insight into engagement.
Scroll Depth
Scroll Depth tracks how far down a page users scroll, typically measured in intervals like 25%, 50%, 75%, and 100%. It helps identify where readers lose interest or miss important CTAs.
This metric distinguishes between users who skim and those who fully engage. When paired with Average Time on Page, it shows whether readers are actively consuming your content or just leaving the tab open.
You can track scroll depth using tools like Google Tag Manager and validate the data with platforms like Microsoft Clarity. If you notice a significant drop-off before the halfway mark, consider tightening your introduction or adding more engaging visuals near the top. Use subheadings, bullet points, and images to encourage readers to scroll further.
| KPI | Excellent | Good | Needs Work |
|---|---|---|---|
| Internal Link CTR | > 25% | 15-25% | < 10% |
| Pages per Visit | > 3 | 2-3 | < 1.5 |
| Page Scroll Depth | > 75% | 60-75% | < 40% |
Tools for Measuring Blog Engagement KPIs
You don’t need an elaborate setup to track blog engagement effectively. With the right tools, you can get a clear view of how your audience interacts with your content. Many bloggers stick to a handful of reliable platforms that cover different aspects of engagement.
Google Analytics
Google Analytics (GA4) is a go-to tool for tracking blog performance – and it’s free. It provides key metrics like pageviews, average engagement time (typically around 54 seconds across industries), and bounce rates (which often fall between 41% and 55% for blogs).
To get started, head to analytics.google.com and add your blog as a property. During setup, enable Enhanced Measurement to automatically track things like scroll depth, outbound clicks, and site searches. You’ll receive a "G-" Measurement ID, which needs to be added to your site’s header.
If you’re using WordPress, plugins like MonsterInsights make this process easier. Instead of editing code, you can paste your Measurement ID directly into your dashboard. MonsterInsights also pulls Google Analytics reports into your WordPress admin area and tracks extras like affiliate links and form conversions.
While GA4 is powerful – offering insights into traffic sources, user demographics, and conversion funnels – it can feel overwhelming at first. Reports like "Behavior Flow" or "Content Drilldown" take some time to master. To stay on top of trends without overanalyzing daily changes, set a regular review schedule: weekly for established blogs or monthly for newer ones.
For additional insights, especially on how users interact visually with your site, consider using complementary tools.
Blogger Outline Tools Recommendations

To enhance your GA4 data, try specialized tools that provide visual insights and simplify reporting. Blogger Outline suggests a practical toolset to help you analyze engagement from multiple angles.
- Microsoft Clarity: This free tool offers heatmaps and session recordings, showing exactly how users interact with your content. It highlights behaviors like "rage clicks" (when users repeatedly click on unresponsive elements) and reveals where readers stop scrolling. These insights are critical, especially since 53% of mobile users abandon sites that take more than three seconds to load.
- Jetpack Stats: Designed for WordPress users, Jetpack Stats features a beginner-friendly interface. It delivers real-time data on visitors, top-performing posts, and referral sources – all within your WordPress dashboard. It’s free for personal blogs, with commercial plans starting at $5 per month for up to 10,000 views.
- Databox: This tool consolidates data from Google Analytics, social media platforms, and SEO tools into one dashboard. It’s particularly handy for tracking metrics across different channels and comparing your performance against industry benchmarks.
The Recommended Stack
Blogger Outline suggests a three-tool system for well-rounded insights: Google Analytics for core metrics, MonsterInsights for simplified WordPress integration, and Microsoft Clarity for visual engagement data. Together, these tools offer a mix of numerical data, ease of use, and a deeper understanding of user behavior – all without breaking the bank.
One tip: make sure to exclude your own IP address in your analytics settings. This prevents your personal visits from skewing the data. With this setup, you can turn raw numbers into actionable insights, helping you boost audience engagement and refine your content strategy.
Setting Benchmarks and Analyzing Trends
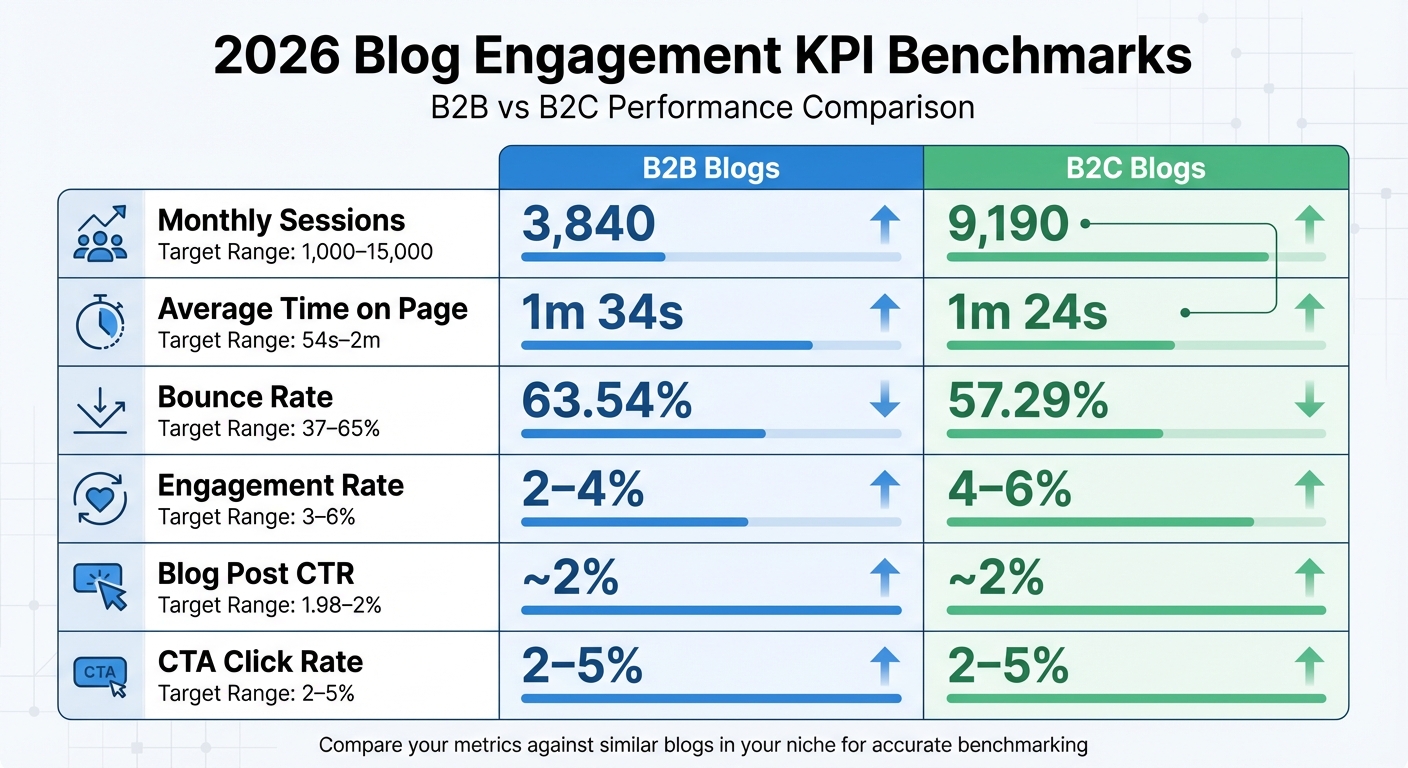
2026 Blog Engagement KPI Benchmarks: B2B vs B2C Performance Metrics
When it comes to engagement KPIs, industry benchmarks provide the context needed to make sense of your data. Without these benchmarks, raw numbers don’t tell the full story.
2026 Industry Benchmarks
Blog performance varies widely depending on your niche and audience. For example, B2B blogs often experience lower traffic but longer engagement times, while B2C blogs typically attract more visitors who spend slightly less time on each page. Below is a snapshot of typical performance metrics for 2026:
| KPI | B2B Median | B2C Median | Target Range |
|---|---|---|---|
| Monthly Sessions | 3,840 | 9,190 | 1,000–15,000 |
| Average Time on Page | 1m 34s | 1m 24s | 54s–2m |
| Bounce Rate | 63.54% | 57.29% | 37–65% |
| Engagement Rate | 2–4% | 4–6% | 3–6% |
| Blog Post CTR | ~2% | ~2% | 1.98–2% |
| CTA Click Rate | 2–5% | 2–5% | 2–5% |
These benchmarks help set realistic expectations and provide a solid foundation for evaluating your blog’s performance. For example, reaching 1,000 monthly sessions often takes 4–6 months, with traction typically building over 3–9 months.
"Benchmarks are only useful when you can compare apples to apples." – Postoria
It’s crucial to compare your blog against others in the same niche. For instance, a tech blog with 5,000 monthly sessions might be underperforming, while a personal finance blog with the same traffic could be excelling.
Creating a KPI Dashboard
Tracking every available metric can lead to "data noise", making it harder to identify meaningful trends. Instead, focus on 3–5 key KPIs that align with your blog’s specific goals. For instance:
- If you’re building an email list, prioritize conversion rate and pages per session.
- For ad revenue, focus on pageviews and average session duration.
- For affiliate marketing, keep a close eye on click-through rates and scroll depth.
Use tools like Google Analytics to create custom reports tailored to your chosen metrics. Set a review schedule – weekly for established blogs or monthly for newer ones – to avoid overreacting to daily fluctuations. When analyzing performance, compare it year-over-year rather than month-to-month to account for seasonal changes. For example, Q4 often sees 20–40% traffic increases, while Q3 can experience 15–30% declines.
Once your engagement rate stabilizes (usually after six months), expect some natural variance of 20–30% above or below your baseline. However, a consistent downward trend over several months could indicate deeper issues, such as content fatigue, algorithm changes, or technical problems affecting user experience.
"Analytics don’t just tell you what happened. They tell you what to do next." – Larry Mac, Voice of BroBlogger
Conclusion
Tracking blog engagement KPIs shifts your content strategy from guesswork to a focused, data-driven approach. Metrics like pageviews, unique visitors, scroll depth, and conversion rates give you the insight to identify what connects with your audience and what falls flat. Without these insights, it’s like driving without a map – wasting effort on content that may never achieve its potential.
The goal isn’t just to gather data; it’s about using it effectively. A small group of engaged readers, like 10 subscribers to your newsletter, is far more impactful than 100 visitors who leave your site immediately. By concentrating on 3–5 key KPIs that align with your objectives, you can filter out distractions and focus on the topics and formats that truly deliver results – whether that’s growing an email list, earning ad revenue, or driving affiliate sales.
You don’t need to invest heavily to get started. Free tools like Google Analytics provide detailed behavioral insights, Microsoft Clarity offers heatmaps and session recordings, and Jetpack Stats delivers real-time dashboards. For those looking to scale, Jetpack’s commercial plans start at just $5 per month for blogs with up to 10,000 monthly views. These tools replace guesswork with clear, actionable data.
Use the 2026 benchmarks mentioned in this guide as a reference, but keep in mind that success depends on your niche and audience. For instance, a B2B blog with around 3,960 monthly sessions and an average time on page of about 1 minute and 18 seconds might be performing just fine. Always compare your metrics to similar blogs in your industry instead of chasing unrealistic goals that don’t fit your content’s purpose.
In 2026, successful bloggers won’t be the ones who churn out the most content – they’ll be the ones who measure, analyze, and adjust based on their data. Set up a regular schedule to review your KPIs, track your progress consistently, and let the numbers guide your decisions. For more tips on analytics, content optimization, and blog growth, check out the resources available at Blogger Outline.
FAQs
Which 5–7 KPIs should I track for my blog goal?
To reach your blog’s objectives, focus on tracking 5–7 key KPIs. These might include:
- Overall blog visits: Monitor how many people are visiting your blog.
- Engagement metrics: Keep an eye on stats like time on page and bounce rate to see how users interact with your content.
- Traffic sources: Understand where your audience is coming from – search engines, social media, or direct visits.
- Top-performing posts: Identify which articles resonate most with readers.
- Conversion rates: Measure how well your blog is driving desired actions, like sign-ups or purchases.
By analyzing these metrics, you’ll gain valuable insights into your audience and effectively gauge your blog’s performance.
How do I set up GA4 to track scroll depth and link clicks?
By default, GA4 tracks scroll depth when users reach 90% of a page. But what if you want to measure other scroll thresholds, like 25%, 50%, or 75%? For that, you’ll need to set up custom triggers in Google Tag Manager (GTM). These triggers can then be linked to GA4 as events, allowing you to monitor user interaction more precisely.
For tracking link clicks, you can also create a custom trigger in GTM. This setup lets you monitor specific links and send the data to GA4 as events, such as ‘link_click’. Both of these processes require manual configuration, either through GTM or directly with code.
What should I do when impressions are high but clicks are low?
If you’re seeing lots of impressions but not many clicks, it’s time to refine your headlines and meta descriptions. Make them engaging, relevant, and tailored to what users are searching for. Your snippets should grab attention by clearly addressing user needs and showcasing the value your content provides. This approach can encourage more clicks and boost engagement.